
K-means clustering
A simple clustering algorithm from a simple approach
Gaussian mixture model is a widely used probabilistic model. For inference (model learning), we may use either EM algorithm which is a MLE approach or use Bayesian approach, which leads to variational inference. We would study this topic next week. For now, let us introduce one of the well-known nonparameteric methods for unsupervised learning, and introduce Gaussian mixture as a parametric counterpart.
K-means clustering
Let us suppose that we know the total number of clusters is fixed as $K$. The objective function of the cluster problem is
$$ J = \sum_{n=1}^K\sum_{k=1}^K r_{nk} |\mathbf{x_n}-\boldsymbol{\mu_k}|^2 $$
where $\boldsymbol{\mu_k}$ is a centroid of $k$th cluster, $\mathbf{x_n}$ is a data vector, and $r_{nk}=1$ if $\mathbf{x_m}$ is in $k$th cluster, and $r_{nj}=0; ^\forall j\neq k$. Our goal here is to choose not only the cluster center (centroids) $\boldsymbol{\mu_k}$, but also the cluster assignment $r_{nk}$ so as to minimize $J$. K-means algorithm achieves this with an iterative algorithm where the centroids and the assignments update successively.
Note that the objective function is given as a sum of Euclidean distances of each vector from its corresponding centroids. For a fixed set of centroids $\boldsymbol{\mu_k}$, each vector should be assigned to the nearest cluster center to minimize $J$. In turn, for a given cluster assignment, we have to choose $\boldsymbol{\mu_k}$ so that $|\mathbf{x_n}-\boldsymbol{\mu_k}|^2$ is minimized. Taking a derivative with respect to $\boldsymbol{\mu_k}$, we see that $2\sum_{n=1}^Nr_{nk}(\mathbf{x_n}-\boldsymbol{\mu_k})=0$ if the centroids is indeed a mean of all the data vectors in $k$th cluster.
All in all, K-means algorithm proceeds as follows;
-
Update assignments: Given the centroids $\boldsymbol{\mu_k}$, update $r_{nk}$ for each data vector as
$$ r_{nk}= \begin{cases} 1 &\quad k=\arg\min_j |\mathbf{x_n}-\boldsymbol{\mu_k}|^2\\\
0 &\quad o.w. \end{cases} $$ -
Update centroids: Given $r_{nk}$, update the centroids $\boldsymbol{\mu_k}$ as
$$ \boldsymbol{\mu_k}=\dfrac{\sum_{n}r_{nk}\mathbf{x_n}}{\sum_n r_{nk}} $$
which is simply just a mean of each cluster.
Some points worth mentioned;
- Computational cost of K-means clustering is roughly $O(NK)$, since at each iteration we have to compute Euclidean distances of $N$ data vectors to each of $K$ cluster centers. This takes quite a toll on the computing power, so there are a few alternatives to mediate this problem. (Refer to PRML p.427)
- Euclidean distance might not be applicable to some data types. In that case, we can come up with some other dissimilarity measure (a sort of metric) such as $V(\mathbf{x, x'})$ and substitute into $J$.
- K-means is a “hard” classifier as each data vector is assigned to exactly one cluster. But in practice, many data vectors lie in between cluster centers, so we might want to assign probabilities of assignment. Such is a motivation behind a “soft” classifier which we would see about shortly.
K-means in R
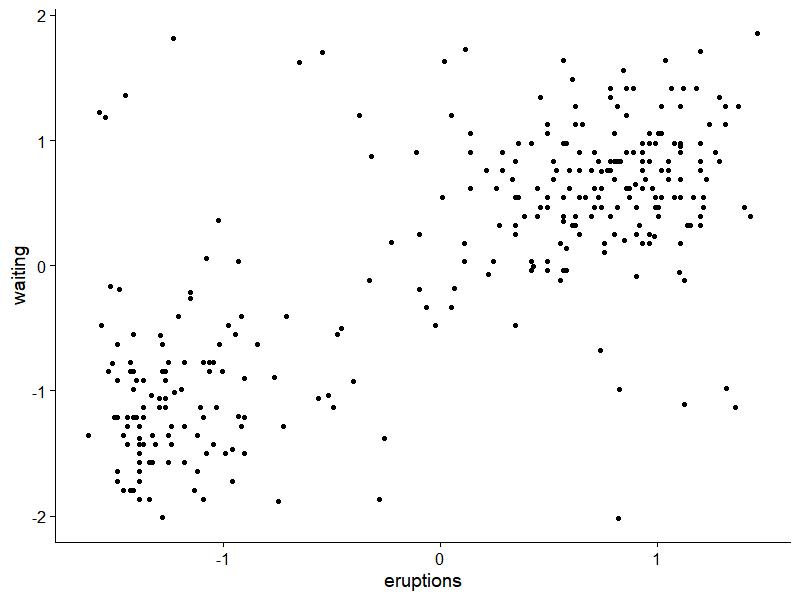
We would use faithful data in R base with some noise added for illustration.
library(ggplot2)
library(gridExtra)
library(cowplot)

nNoise = 50
Noise = apply(faithful, 2, function(x)
  runif(nNoise, min=min(x)-0.1, max=max(x)+0.1))
df = rbind(faithful, Noise)
df = apply(df, 2, function(x){return((x-mean(x))/sd(x))})
df = data.matrix(df)

ggplot(data.frame(df), aes(x=eruptions, y=waiting))+
  geom_point()+
  theme_cowplot()
K-means algorithm in R can be implemented with the following code;
hun_kmeans = function(df, n_K, tol=0.01){

  vectornorm = function(x){return(sqrt(sum(x^2)))}

  df = data.matrix(df)

  ## initialize centroids ##
  sampled_idx = sample(nrow(df), n_K)
  mu = df[sampled_idx, ]

  label = rep(1, nrow(df))
  SSE = 0
  convergence = F

  while(!convergence){

    ## 1. update label ##
    distance = matrix(0, nrow=nrow(df), ncol=n_K)
    for(k in 1:n_K){
      diff = sweep(df, 2, mu[k,], "-")
      diff_norm = apply(diff, 1, vectornorm)
      distance[,k] = diff_norm
    }
    label = apply(distance, 1, which.min)

    ## 2. update centroids ##
    for(k in 1:n_K){
      mu[k,] = apply(df[label==k,], 2, mean)
    }

    ## (compute SSE after each update) ##
    error = rep(0, nrow(df))
    for(k in 1:n_K){
      error[label==k] = apply(df[label==k,]-mu[k,], 1, vectornorm)
    }
    convergence = (abs(SSE - sum(error)) < tol)
    SSE = sum(error)
  }

  result = list(label = label, mu = mu, SSE = SSE)
  return(result)
}
and the result would look like
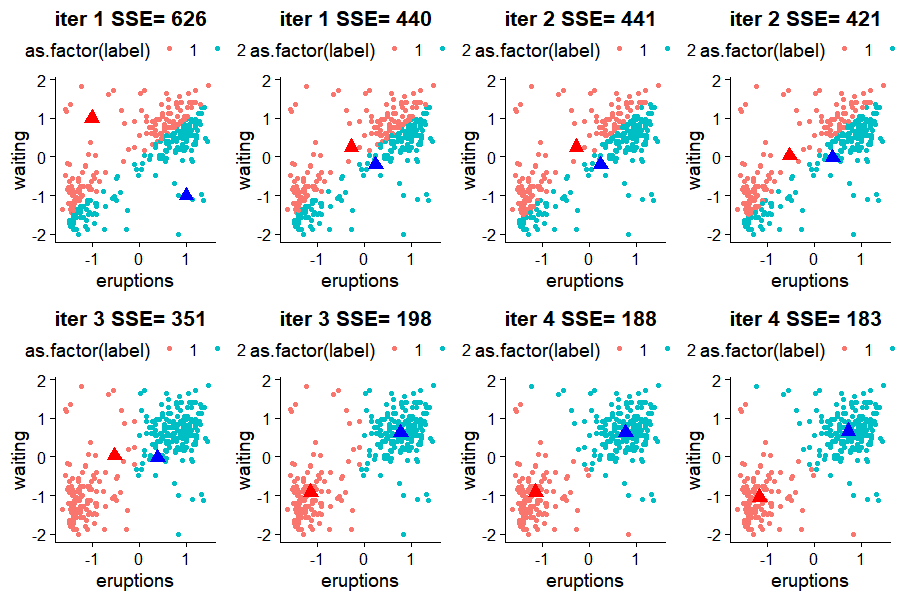
We can see that after 4 iterations, the algorithm found its way into the center of clusters.
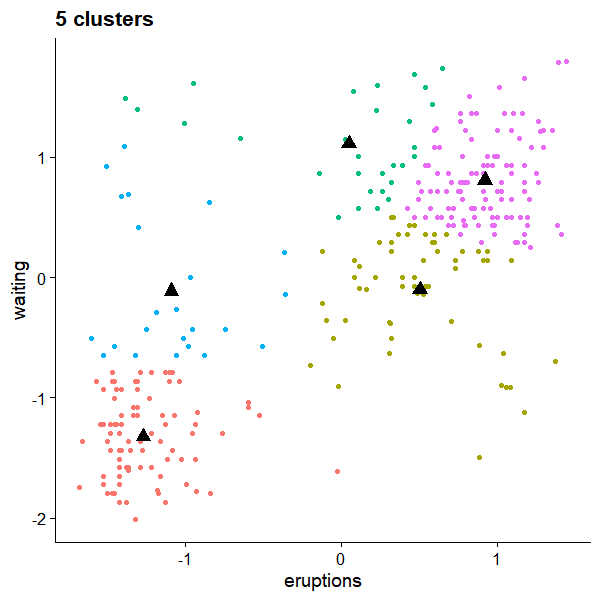
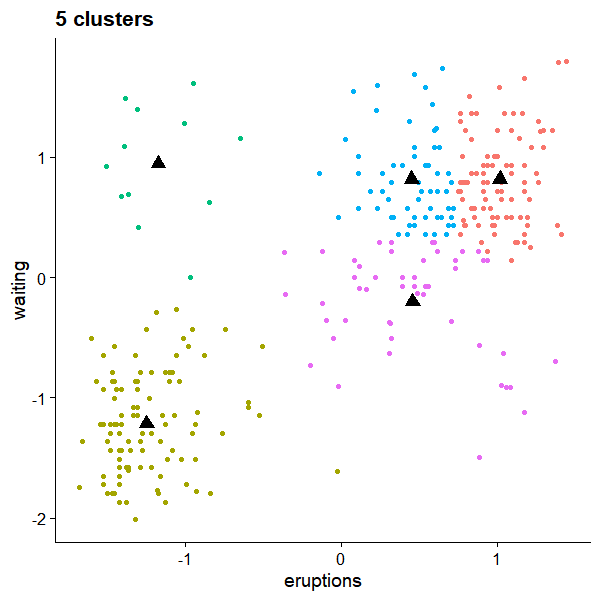
But the convergence is not unique. For k=5, we could have
References
- Pattern Recognition and Machine Learning, Bishop, 2006